
How are APT-weighted images acquired? APT 加权图像是如何获取的?
How are APT-weighted images acquired?
APT 加权图像是如何获取的?
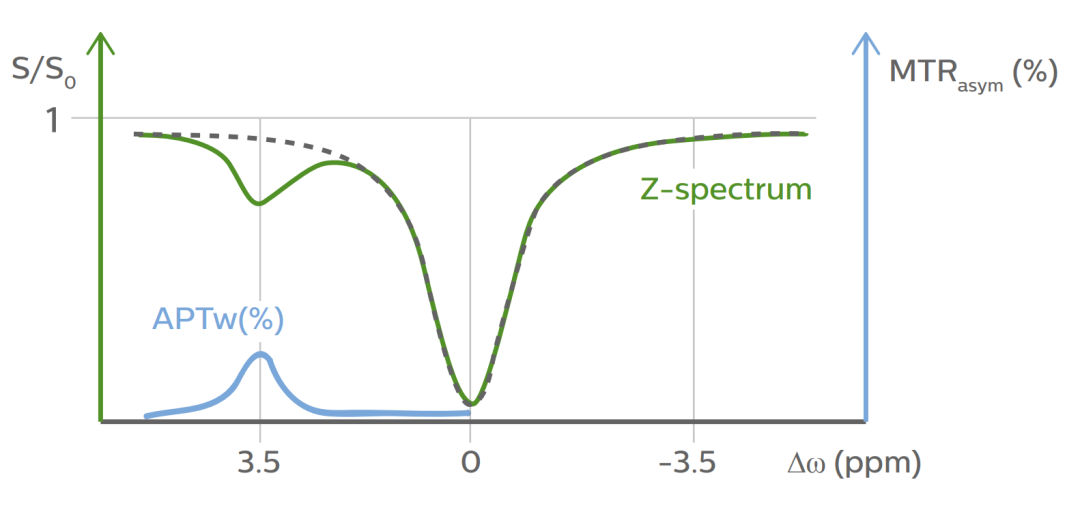
The saturation of the water signal as described is the first step to obtain an APTw image. Subsequently, to generate reliable APTw imaging contrast, the so-called MTR asymmetry (MTRasym(%)) is assessed. This requires the acquisition of a Z-spectrum, where a series of water signal levels is measured as a function of different frequency offsets, ∆ω (Figure 2).
如前所述,水信号的饱和是获得 APTw 图像的第一步。进而要想得到可靠的 APTw 图像对比,需要计算所谓的非对称磁化传递比例 (MTRasym(%)) ,这需要采集 Z-谱,它是设置不同的频率偏置 ∆ω 饱和射频脉冲时所测得的一系列自由水信号水平所组成的函数。
Figure 2: The Z-spectrum (green) represents the water signal saturation (S/S0) as a function of the frequency offset ∆ω of the RF saturation pulse. In the presence of amide groups, there is a signal drop at 3.5 ppm. Furthermore, there is full signal saturation at 0 ppm, because the RF saturation pulse directly saturates the proton spins in the water molecules. From the Z-spectrum, the so-called magnetization transfer asymmetry (MTRasym) (blue) is assessed and measured in percent (%). For APTw imaging, MTRasym is calculated as difference between the Z-spectrum at ∆ω=-3.5 ppm and at ∆ω=+3.5 ppm, normalized to the S0 image (measured without RF saturation). This specific MTRasym is being referred to as APTw%.
图2:Z-谱(绿色)表示水信号饱和 (S/S0) 关于射频饱和脉冲频率偏置 ∆ω 的函数。如果有酰胺基的存在,那么在 +3.5ppm 处会有一信号的下降。更进一步,在 0ppm 处,由于射频饱和脉冲直接作用于水分子中的氢质子,那么水信号被完全饱和。从 Z-谱中可以计算所谓的非对称磁化传递比例 (MTRasym) (蓝色) ,用百分比表示。对于 APTw 成像,MTRasym 通过计算 Z-谱在 ∆ω=-3.5 ppm 与 ∆ω=+3.5 ppm 处的差值,并归一化到 S0 图(未施加饱和脉冲所测得的水信号)。这一特定情形下的 MTRasym 称之为 APTw%.
%%%%%%%%%%%%%%%
Magnetization transfer contrast (MTC), a mechanism that is used to indirectly detect macromolecular properties in magnetic resonance imaging (MRI) by observing the exchange of magnetization between "free" and "restricted" water protons in macromolecules, was originally introduced over 20 years ago. MTC effects vary in human tissues and organs due to different macromolecular compositions therein; as a result, MRI contrast can be generated among these tissues by taking advantage of the different proton exchange levels. The well-known MTC effect has proven beneficial in evaluating the morphology of brain, kidney, and myocardium, as well as improving the contrast between blood and brain parenchyma in intracranial MR angiography.
The MTC effect has also been used to study specific exchangeable protons resonating at different frequencies by selectively saturating them and observing the resulting change in the free water signal, a technique known as chemical exchange saturation transfer (CEST) . In CEST, protons unobservable in MR spectroscopy due to short lifetime or fast exchange are irradiated by off-resonance RF pulses and observed indirectly in the Z-spectra (i.e., signal observed on resonance as a function of the selective irradiation frequency). However, conventional CEST is used to observe the relative density of H-groups of interest at specific chemical shifts, and the usual offset frequency range (±1000 Hz) does not cover the broad spectrum of ultra-short T2 components far greater than ±1000 Hz in width.
Wide range Z-spectra have been investigated using a super-Lorentzian lineshape with acquisition of half the frequency range. In this work, we analyzed Z-spectra acquired over a broad and symmetric range of frequency offsets by fitting them to a two Lorentzian compartment model, without the need to consider the detailed kinetics of the exchange process. The technique we propose—Z-spectrum Analysis Provides Proton Environment Data (ZAPPED)—allows us to map and extract important properties and information in both the free and restricted exchangeable proton pools, including the proton fractions (Fr and Ff = 1—Fr) and apparent spin-spin relaxation times (T2,f, T2,r) derived from fitted Lorentzian linewidths. (Here “exchangeable” is short for “subject to magnetization transfer”—whether by dipolar coupling or actual chemical exchange.) With this simple imaging and analysis method, both ultra-short and long spin-spin relaxations can be quantified, even though the ultra-short restricted component is not directly observable in MR spectroscopy. We then expanded this method to investigate how these two exchangeable proton environments affect the MRI contrast of gray matter (GM) and white matter (WM) in segmented human brain, and further investigated the potential of this novel MT technique in clinical applications, such as brain tumor imaging.
from 文献《Z-Spectrum Analysis Provides Proton Environment Data (ZAPPED): A New Two-Pool Technique for Human Gray and White Matter》
什么是 Z-谱?我想大家已经能够知晓了,它就是一个函数曲线,横坐标为不同的频率偏置,代表使用不同的偏共振频率的射频脉冲去饱和组织,然后测量自由水的信号强度,即为纵坐标的值,当然这里的纵坐标值被归一化到 S0 了,什么是 S0 呢,就是没有施加饱和脉冲所测得的自由水的信号强度。这样,所得的 Z-谱的纵坐标的值都在 0%~100% 之间。当预饱和的脉冲就恰好打在自由水的共振频率处,那么就是从上图中能看到的中心 0ppm 处的一个大大的“凹陷”,因为此时测得的自由水的信号强度 S 趋于零,那么 S/S0 也接近零。而当频率往两边偏离时,离自由水的进动频率越来越远,那么自由水被化学交换/磁化传递所导致的饱和效应越来越轻,从而测得的自由水信号越来越高,也即 S/S0 越来越接近于 1。
当组织中没有生物大分子中的特定氢原子被共振饱和时,只是部分的结合水被饱和,那么 0ppm 的两侧应该是对称的,因为结合水的共振频率的分布十分广泛且对称。
from indexsmart.mirasmart.com
而 Z-谱的表现是不对称的,就是因为在 +3.5ppm 处是酰胺质子(-NH)的共振频率,而当组织在存在大量的蛋白质/多肽时,那么就会产生大量的酰胺质子被饱和,同时也有此频率的结合水被饱和。那么就会在 +3.5ppm 处出现一个较大的信号下降(如果组织中存在蛋白质/多肽),亦即自由水的信号不仅由于结合水的磁化传递而导致的一小部分的下降,更多的是来自于酰胺质子的化学交换而导致的饱和。因此,在计算酰胺质子的饱和贡献时需要减去本来就有的结合水的贡献,也就白皮书图 2 中的绿色虚线 Z-谱,亦可以认为是完全没有蛋白质/多肽时的 Z-谱。
In such a spectrum, the water signal saturation is measured as a function of saturation frequency. For convenience, the water frequency (normally around 4.75ppm in the proton MR spectrum) is placed at 0 ppm in the Z-spectrum. It is found that the signal is saturated partly when the RF frequency is at +3.5 ppm relative to water protons, and drops to a minimum at ∆ω= 0 ppm, since at this point, the RF pulse directly saturates the water protons. In order to distinguish the APT signal from several background effects (e.g. direct water saturation and magnetization transfer contributions from semi-solid tissue components such as membranes) an MTRasym analysis (asymmetry with respect to the water frequency) is performed based on a voxel-by-voxel analysis.
在这样一个谱中,水信号的饱和程度是预饱和脉冲频率的函数。为了简便起见,在 Z-谱中,将自由水的频率作为 0ppm(而在常规的 1H-MRS 中,自由水的进动频率通常约位于4.75ppm)。从 Z-谱中发现,当射频脉冲频率相对于水质子在 +3.5ppm 时,水信号在一定程度上被饱和,并且在 ∆ω= 0 ppm 时,水信号强度掉到最低,是因为这时射频脉冲直接作用于水质子上进行饱和。为了从一些背景效应(例如直接水抑制、细胞膜等半固体的组织成分所造成的和磁化传递效应)中区分出 APT 信号,需要对每个体素进行非对称磁化传递比例分析(非对称是关于自由水频率而言的)。
First, the Z-spectrum is aligned per voxel using information on local magnetic field variation (B0 field map) such that the maximum direct water saturation is found exactly at 0 ppm. Next, the asymmetry is evaluated by subtracting the positive frequency side S[+∆ω] from the negative side S[-∆ω] and normalized to an unsaturated image S0 (See equation 1).
首先,每个体素的 Z-谱使用 B0 图信息来进行处理,这样就能将最大程度的自由水直接饱和的频率位置准确地置于 0ppm。接下来,非对称分析通过将负频率 S[-∆ω] 侧的值减去正频率 S[+∆ω] 侧的值来进行,并且使用未施加预饱和的 S0 图进行归一化处理(见公式 1)。
The resulting MTRasym value at +3.5 ppm is displayed as percent level (relative to S0) in the final APTw images, and referred to as APTw% (Equation 2).
最终在 +3.5ppm 处得到的 MTRasym 值定义为 APTw%,并且在 APTw 图中以百分比水平(相对于 S0)来进行显示(公式 2)。
不感兴趣
看过了
取消

人点赞

人收藏

打赏
不感兴趣
看过了
取消
©2012-2023 北京华媒康讯信息技术股份有限公司 All Rights Reserved. 注册地址:北京 联系电话:010-82736610
广播电视节目制作经营许可证 —(京)字第 17437号 京海食药监械经营备20200522号
京ICP备12011723号 京ICP证150092号
 京公网安备 11010802020745号
工商备案公示信息
互联网药品信息服务资格证书((京)-非经营性-2020-0015)
京公网安备 11010802020745号
工商备案公示信息
互联网药品信息服务资格证书((京)-非经营性-2020-0015)


您已认证成功,可享专属会员优惠,买1年送3个月!
开通会员,资料、课程、直播、报告等海量内容免费看!

打赏金额
认可我就打赏我~
1元 5元 10元 20元 50元 其它
打赏作者
认可我就打赏我~
扫描二维码
立即打赏给Ta吧!
温馨提示:仅支持微信支付!
已收到您的咨询诉求 我们会尽快联系您


 010-82736610
 股票代码: 872612


